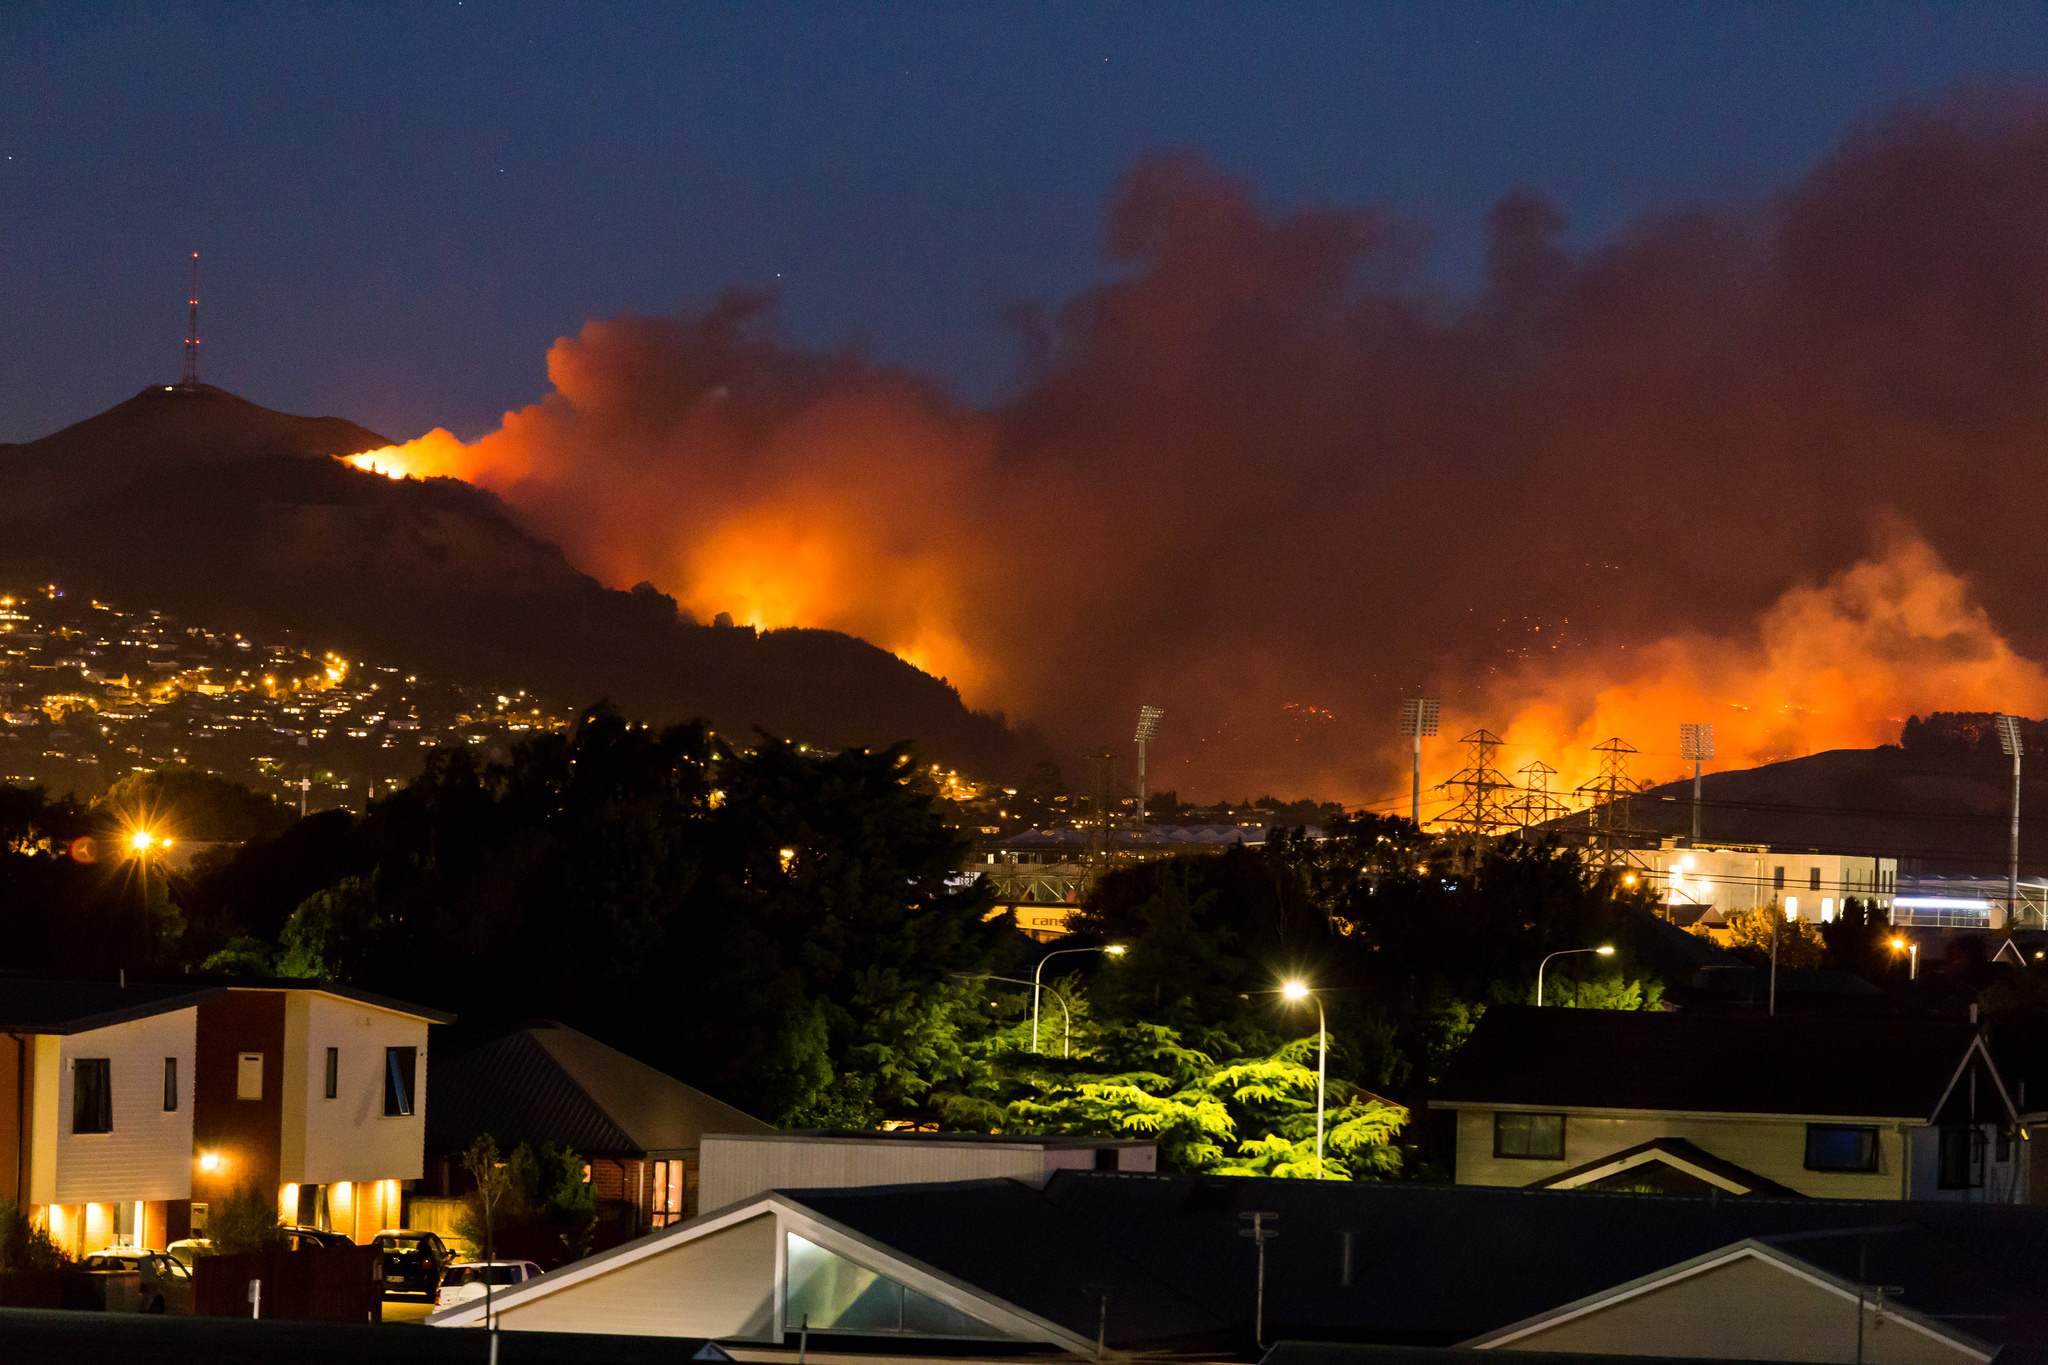
The recent fires in the Christchurch Port Hills caused enormous destruction and disturbance to those living in the area. Tragically a life was lost fighting the blaze, and there was major disruption when about 450 houses were evacuated, 11 homes destroyed, and over 1800 hectares scorched in the region between the suburbs of Cashmere, Westmorland, Kennedy’s Bush and Governor’s Bay.
Concerned citizens during the crisis created a Facebook group named “Evacuation housing” where people could share information, and offer food or shelter to those who had been evacuated. I wanted to understand who participates in such social media responses to a crisis, so decided to study the political affiliations of the people who joined this group. I did this by examining publicly available information about each member’s past behaviour on Facebook to determine their political orientation, and then plotted this data on several graphs to help visualise the findings.
Findings

A quick look at the method
The method behind the study is simple, though not easily implementable. First, data was collected using the public Facebook Graph API 2.7 https://developers.facebook.com/docs/graph-api/reference/v2.7/. I collected data on all individual users who had been active on any of the public Facebook pages represented by a politician currently in parliament. All users who had not liked at least 7 posts from any of the pages were filtered out, which produces a little less than 200,000 unique users in New Zealand. Each user’s political affiliation is based on the political party from which the users has liked to most post on a percentage basis. Almost 1100 users could be identified with a probable political affiliation out of the 3500 members of the public group “Evacuation Housing” https://www.facebook.com/groups/1199742336810603/.
Conclusion
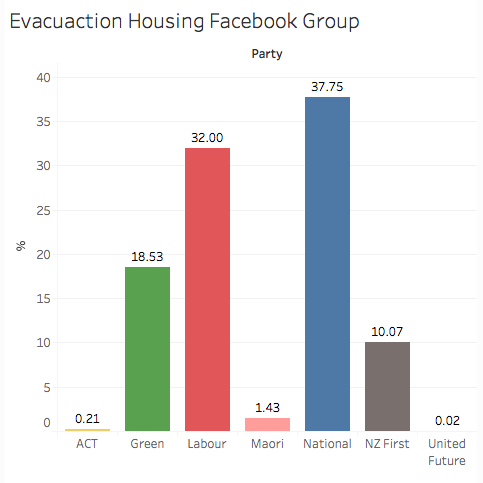
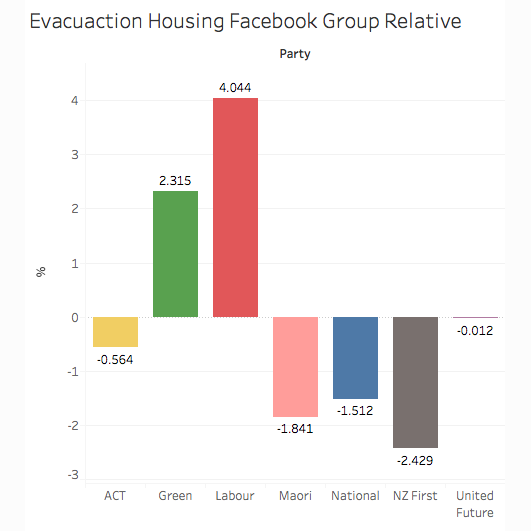
At the outset Fig 1.0 shows a fairly balanced distribution of affiliation with the political parties. On Fig 1.1 we see that Green and Labour are somewhat over-represented. Fig 1.2 shows that interactions within the group do not form clusters of users who are only affiliated with the same party.
In the age of filter bubbles, echo-chambers and behaviour-altering algorithms we see that online spaces still allow different people to come together and help each other in a time of crisis. This very small, very limited data-driven look into a spontaneously created Facebook group shows how political orientation is not overly skewed toward one particular group when it comes to issue based community formation. Even though some political groups are overrepresented it is not enough to constitute a so-called echo chamber, a place where only likeminded people interact. The actual significance of over- and underrepresentation by political groups in this case will require deeper analysis.
This study is also a peek into how the public behaviour of individual users can be applied to create segments and find out how these segments are mobilized for a certain cause. Future studies could involve the same political segmentation to be used to in other contexts or other segments could be created using the same basic method.